After the floods come the infectious diseases…
Houston floods: What are the infectious disease risks?
Outbreak News Interviews
29 August 2017
With record amounts of rain and unprecedented flooding, Houston and the southeastern part of Texas have their hand full with rescues, shelters and numerous public safety issues. What about the infectious disease situation that goes along with a natural disaster like this? Waterborne diseases? Mosquito borne diseases? Concerns about tetanus?
I had the opportunity to talk about these issues with the director of the Center for Infectious Disease Research and Policy (CIDRAP) at the University of Minnesota, Michael Osterholm, PhD on the podcast.
Podcast: Play in new window | Download
[Byline Robert Herriman]

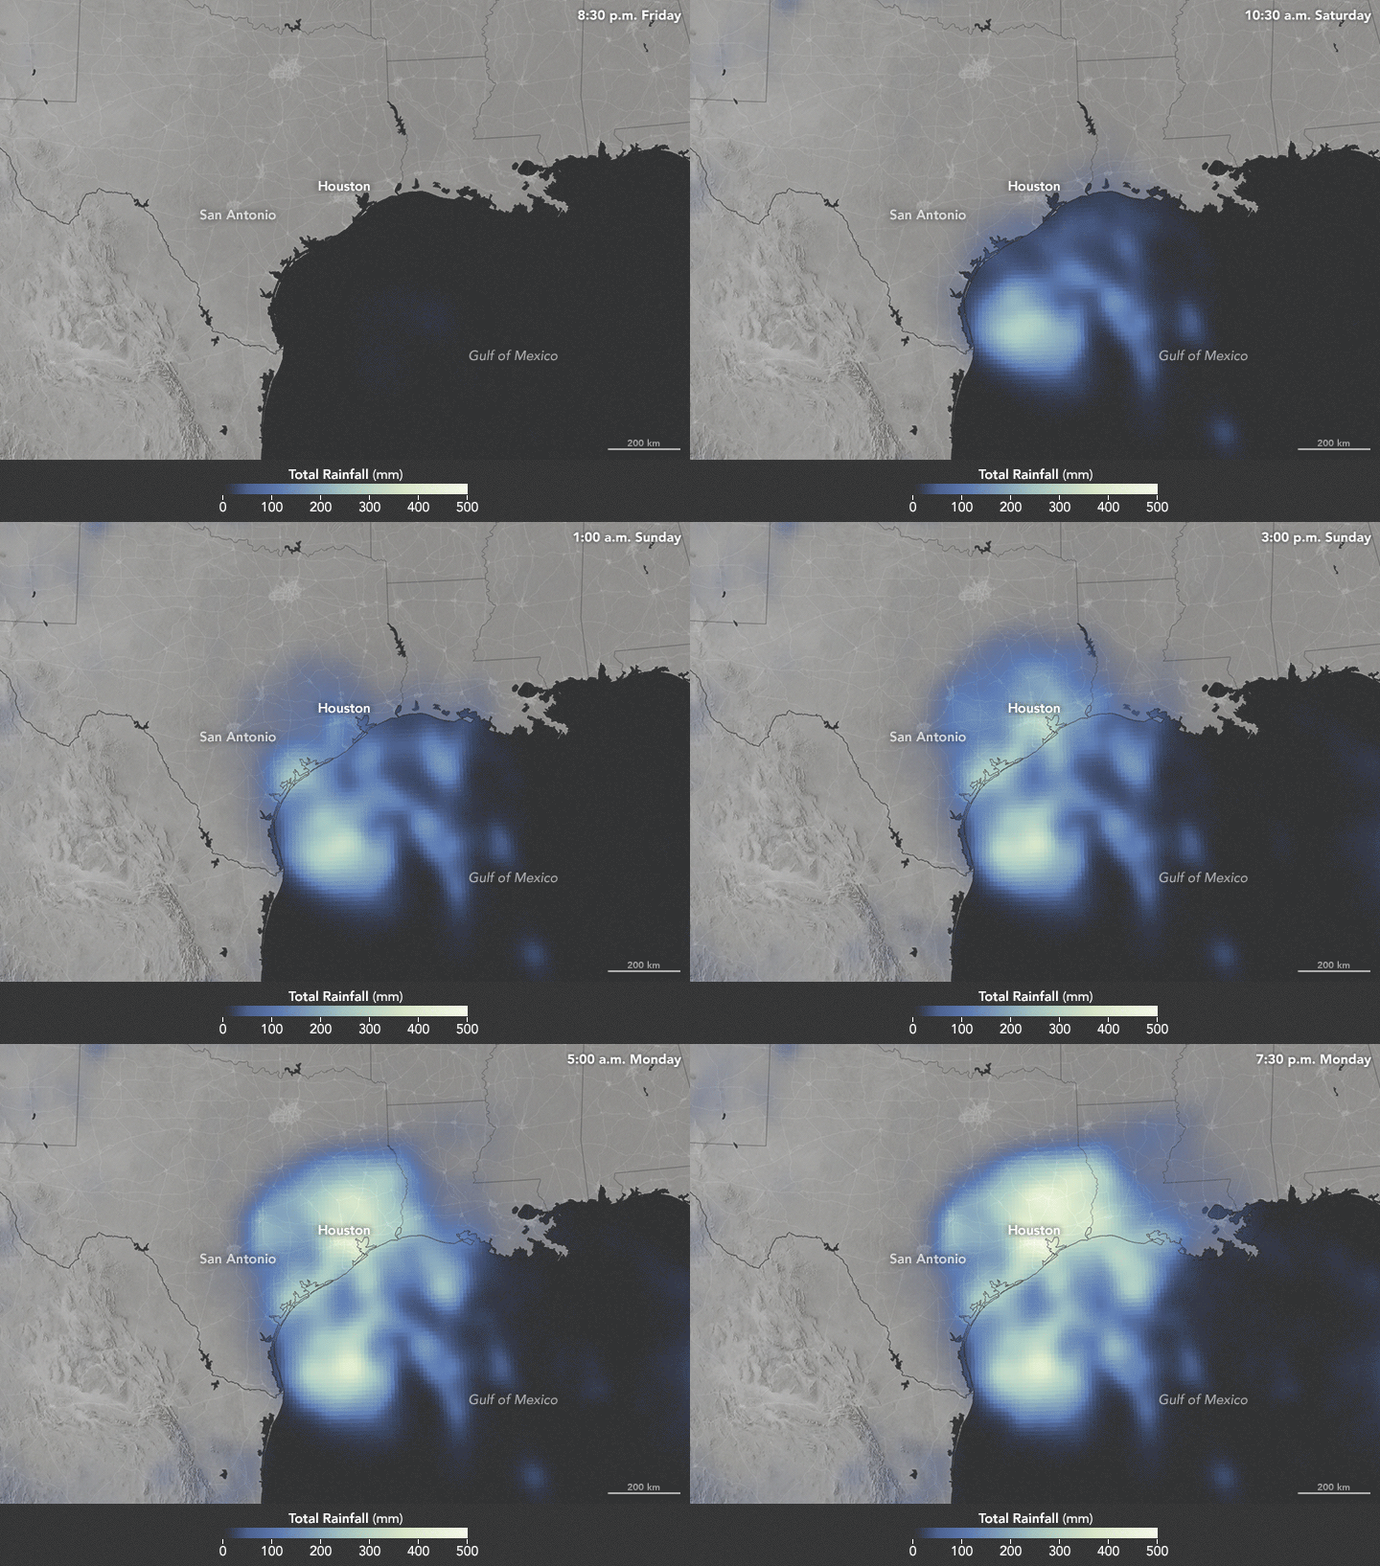
Hurricane Harvey Drops Devastating Rain on Texas. NASA Earth Observatory image by Joshua Stevens, using IMERG data provided courtesy of the Global Precipitation Mission (GPM) Science Team’s Precipitation Processing System (PPS). Story by Kathryn Hansen.
Harvey Drops Devastating Rain on Texas
Torrential rains from Hurricane Harvey (now a tropical storm) continue to batter the flood-ravaged Texas, and the threat is now stretching into southwestern Louisiana. The sluggish storm—moving just 4 kilometers (2 miles) per hour at times—has been pulling warm, moist air from the Gulf of Mexico to fuel tremendous rainfall over land.
The animation above depicts satellite-based measurements of rainfall from 7:30 p.m. Central Daylight Time on August 25 to 7:30 p.m. on August 28, 2017. The brightest areas reflect the highest rainfall amounts, with many places receiving 500 millimeters (20 inches) or more during this period (the top of our scale). The measurements are a product of the Global Precipitation Measurement (GPM) mission, which is a partnership between NASA, the Japan Aerospace Exploration Agency, and five other national and international partners.
These rainfall totals are regional, remotely-sensed estimates. Each pixel shows 0.1 degrees of the globe (about 7 miles at the equator), and the data are averaged across each pixel. Individual ground-based measurements within a pixel can be significantly higher or lower than the average. Forecasters called for some locations to receive as much as 50 inches of rain.
According to the National Weather Service, a station southeast of Houston is nearly there. The rain gauge at “Mary’s Creek at Winding Road” recorded 49.2 inches from 12 a.m. on August 25 to 9:20 a.m. on August 29. The amount breaks the record for rainfall measured from a tropical system in the continental United States, which was previously set in 1978 in Medina, Texas, by Tropical Cyclone Amelia. See a summary of storm totals by clicking here.
Data for the animation comes from the Integrated Multi-Satellite Retrievals for GPM (IMERG), a product of the GPM science team. IMERG compiles precipitation estimates from passive microwave and infrared sensors on several satellites, as well as monthly surface precipitation gauge data, to provide precipitation estimates between 60 degrees North and South latitude.
Harvey made landfall in Texas as a category 4 storm on August 25. As of August 29, the National Hurricane Center was calling for 6 to 12 more inches of rain to fall over parts of Texas and Louisiana. Storm surges and ocean swells continued to affect coastal areas, and the development of tornadoes remained possible.
References
NASA Earth Observatory (2017, August 28) Harvey Stalls Over Southeastern Texas.
NASA Earth Observatory (2017, August 25) Hurricane Harvey Approaches Texas.
NASA’s Goddard Space Flight Center (2017, August 28) Harvey: (Update #2) NASA Calculates Tropical Storm Harvey’s Flooding Rainfall. Accessed August 28, 2017.
National Hurricane Center (2017, August 29) Key Messages for Tropical Storm Harvey. Accessed August 29, 2017.
NASA Precipitation Measurement Missions (2017, August 29) NASA’s IMERG Shows Rainfall Accumulation Along Harvey’s Track. Accessed August 29, 2017.
The Weather Prediction Center (2017, August 29) Storm Summary Message. Accessed August 29, 2017.
NASA Earth Observatory image by Joshua Stevens, using IMERG data provided courtesy of the Global Precipitation Mission (GPM) Science Team’s Precipitation Processing System (PPS). Story by Kathryn Hansen.
NASA Earth Observatory (edited)
See Also
Melioidosis in Thailand: Nearly 2,000 cases reported this year
Thailand health officials are advising people not to wade in water as the run the risk of the serious bacterial infection, melioidosis.
According to the Thai Bureau of Epidemiology (computer translated), since the beginning of the year, 1978 cases, including 21 deaths have been reported through Aug 21.
Cases have been reported in 64 of the country’s provinces with the highest rates reported in the northeast region.
Melioidosis (also known as Whitmore disease and Nightcliff gardener’s disease) is caused by the bacterium, Burkholderia pseudomallei. The disease though somewhat rare has been seen in areas of Southeast Asia and Northern Australia, particularly after heavy rains. In Thailand it is considered a disease of rice farmers.
The organism is saprophytically found in soil and water. People usually get infected by contact with contaminated soil or water through skin wounds, inhalation or rarely through ingestion of contaminated water.
Person to person transmission can occur through contact with blood and body fluids of an infected person.
[…]
Fatality rates of melioidosis can reach up to 75 percent even with appropriate antibiotic treatment. Fatalities are particularly greater in those with underlying conditions like diabetes mellitus or renal disease.